About the Project
This greenhouse gas (GHG) profile breaks down the regional sectors that contribute directly to climate emissions. Understanding the sources of GHG emissions and establishing a baseline are critical first steps in the regional climate action process. A GHG inventory is a comprehensive analysis of emissions from various sources, including transportation, materials management, agriculture, and energy consumption across residential, commercial, and industrial sectors.
GHG inventories provide the data needed to set realistic goals and track progress toward reducing costs, energy use, and emissions. By identifying the largest sources of emissions in the region, GHG inventories help local governments, nonprofits, businesses, community groups, and other regional partners focus on the most important sectors.
Regional GHG Breakdown
By Sector

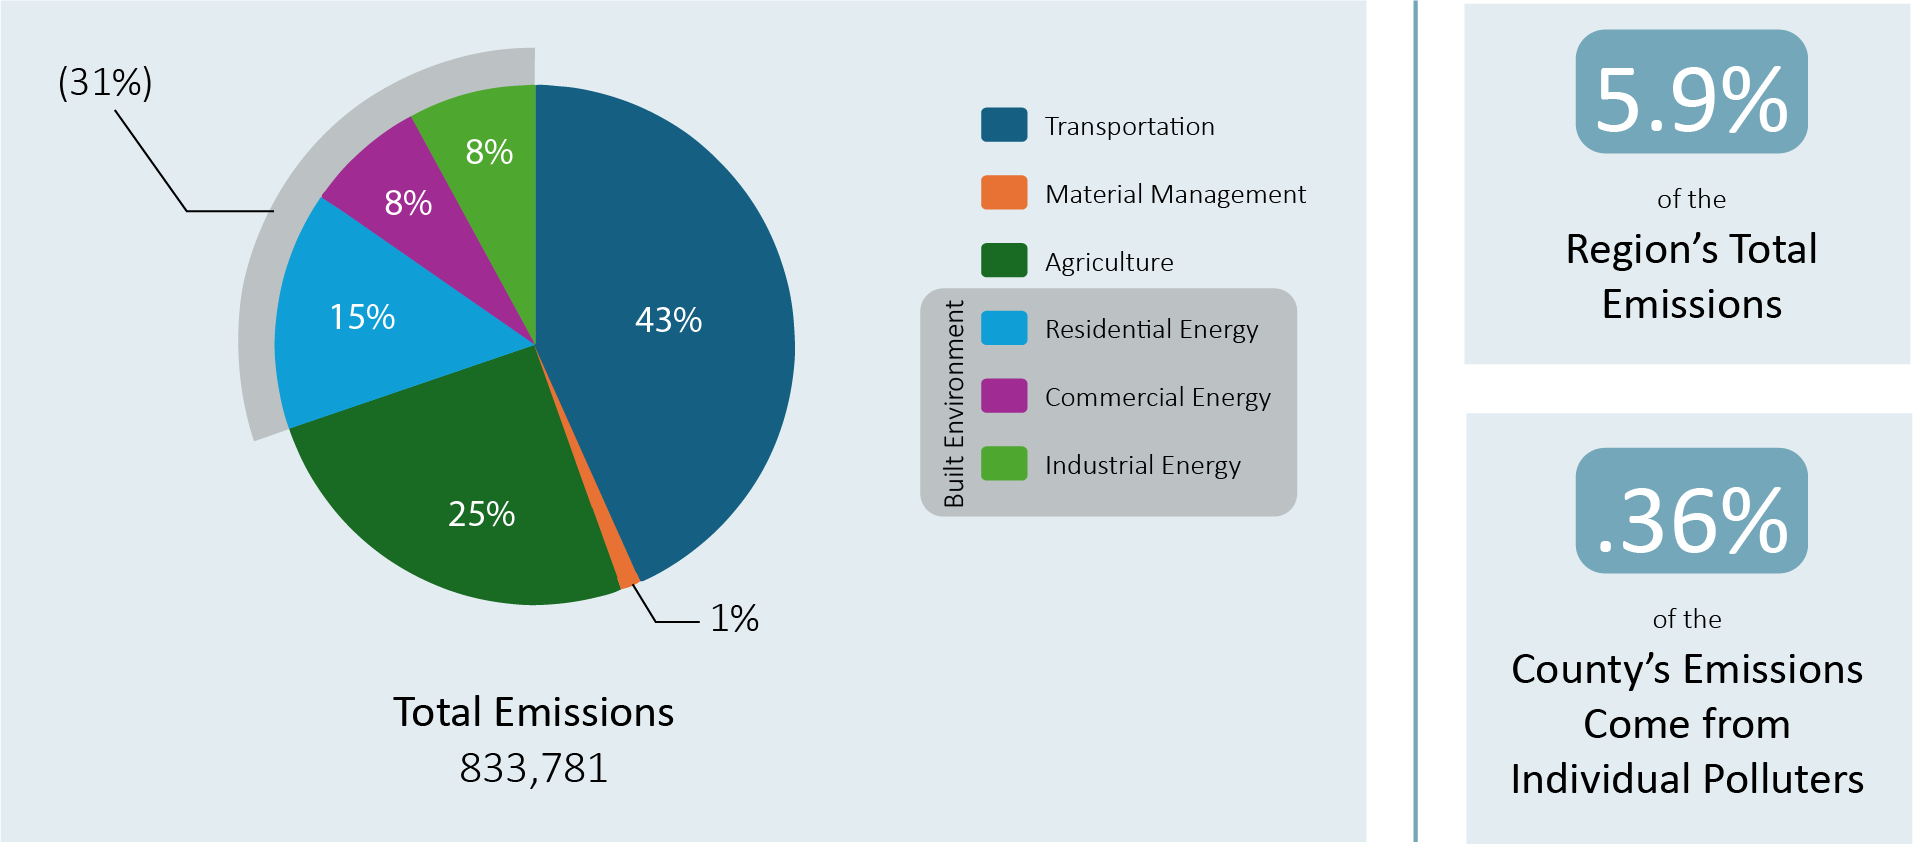
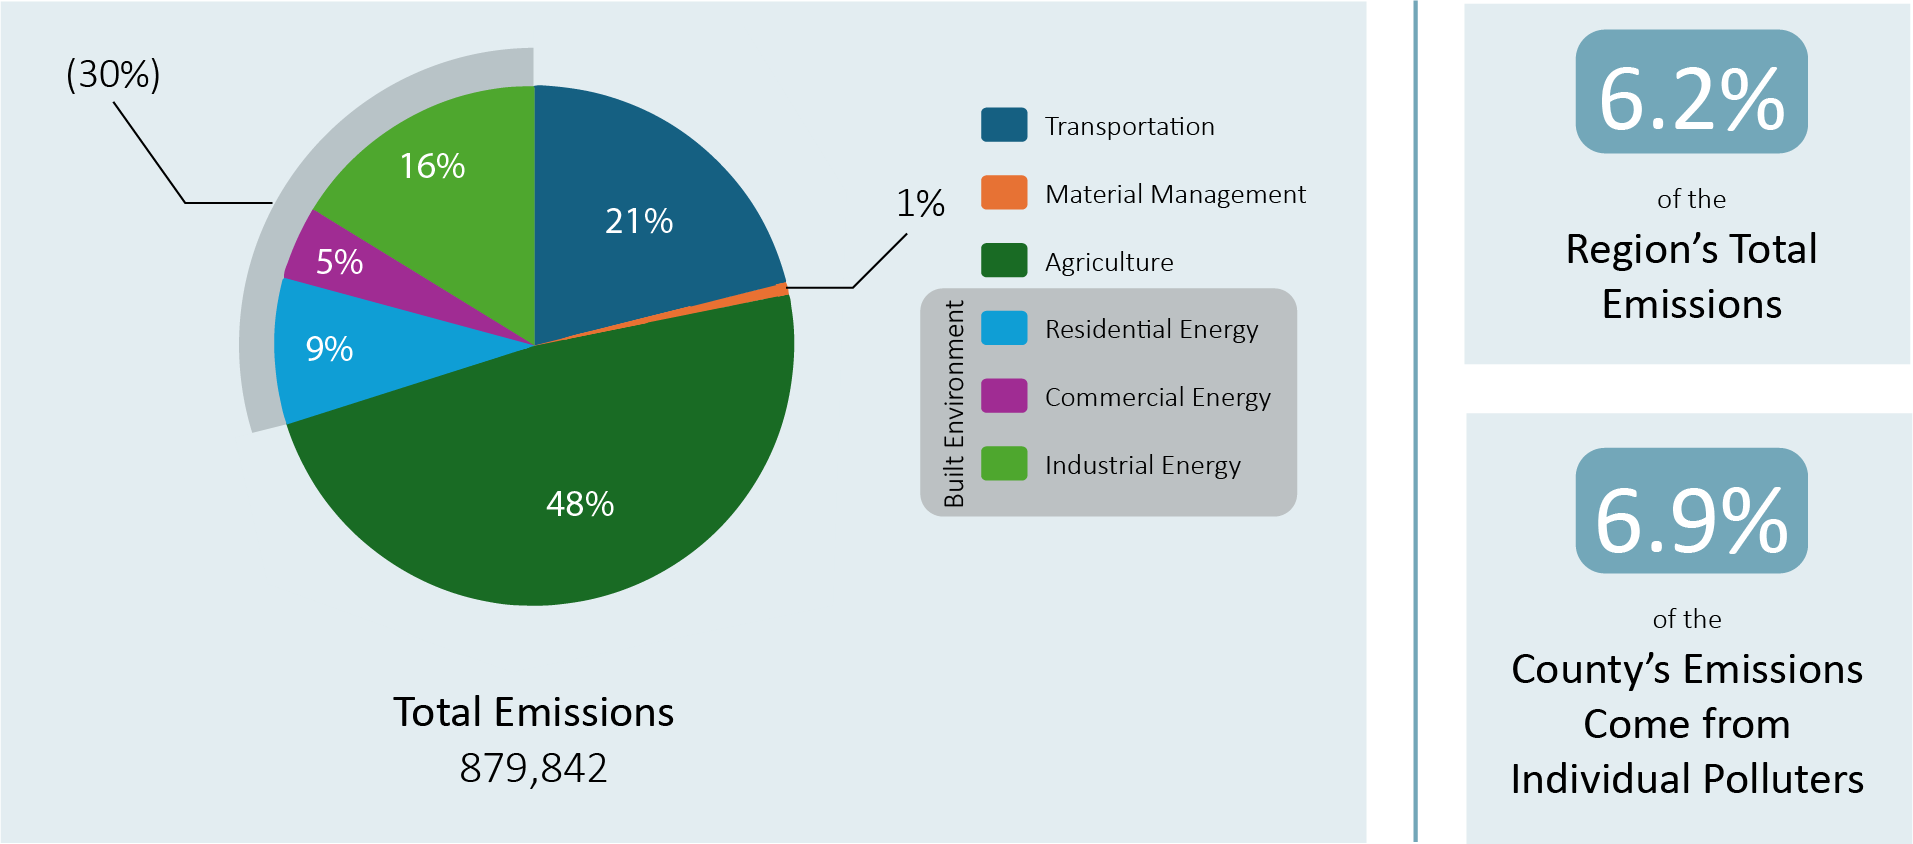
The largest contributors to greenhouse gas emissions in our region continue to be transportation and the built environment (residential, commercial, and industrial) sectors. These sectors have consistently been the primary drivers of emissions due to factors such as heavy reliance on fossil fuels for transportation and the energy consumption associated with heating, cooling, and powering buildings.
Interestingly, the two sectors that have not seen reductions are material management (waste) and agriculture. In the waste sector, while some progress has been made in terms of recycling and waste diversion, the overall impact of emissions remains largely unchanged. This may be attributed to the continued increase in the generation of waste, combined with the challenges surrounding waste treatment processes, such as landfill methane emissions and the energy-intensive nature of waste management operations.
The agriculture sector, in particular, has seen an increase in reported emissions, which can be attributed to several factors. One key driver is the increase in the reported livestock population over the past 15 years. As the population of livestock grows, so too does the methane emissions associated with animal digestion, particularly ruminants like cattle.
By County
| County | GHG | %of GHG | 2022 Population | % of Population |
| Genesee | 1,111,502 | 7.8% | 58,388 | 4.8% |
| Livingston | 833,781 | 5.9% | 61,834 | 5.1% |
| Monroe | 7,301,346 | 51.4% | 759,443 | 62.1% |
| Ontario | 1,605,460 | 11.3% | 112,458 | 9.2% |
| Orleans | 434,113 | 3.1% | 40,343 | 3.3% |
| Seneca | 575,806 | 4.1% | 33,814 | 2.8% |
| Wayne | 841,297 | 5.9% | 91,283 | 7.5% |
| Wyoming | 879,842 | 6.2% | 40,531 | 3.3% |
| Yates | 623,650 | 4.4% | 24,774 | 2.0% |
| Total | 14,206,798 | 1,222,868 |
Emissions across our region tend to follow a mostly consistent pattern, largely driven by the population distribution and the concentration of businesses and industries in urban centers. Generally, counties with larger populations and more densely concentrated industries, such as those located in urban areas, tend to have higher emissions. This correlation is not coincidental, as transportation, energy use in buildings, and industrial processes are directly linked to population density and economic activity. However, it's important to note that each county has a county-level greenhouse gas (GHG) analysis, which provides a more detailed breakdown of emissions specific to their region. This allows us to understand the unique emissions profiles of each county, taking into account their local contexts and contributing factors.
Understanding these local emissions patterns is critical for tailoring effective climate action strategies that address the unique needs of each county while working toward regional and statewide GHG reduction goals.
County-Level GHG Inventory


Methodology
The Genesee/Finger Lakes Regional Planning Council (GFLRPC) collaborated with the University of Buffalo’s Research Institute (UBRI), the Capital District Regional Planning Commission (CDRPC), and Climate Action Associates to reevaluate and update the New York Community and Regional GHG Inventory Guidance developed in 2015. This guide is a collection of methods and data sources specific to resources provided by and readily available in New York State.
While there are a range of methods outlined in the guide, this regional profile was developed using the following standards by sector:
Transportation: The transportation sector includes GHG emissions from fuels and energy used to power transport vehicles and related equipment. This sector is typically one of the largest, if not the largest contributor of GHG emissions in a community.
| Source | Description of Source | Scope | |
| On Road | Direct emissions from on-road vehicles within the boundary. | 1 | |
| Non-Road | Direct emissions from off-road equipment (construction, agricultural, lawn care, etc.) within the boundary. | 1 | |
| Rail | Direct emissions from rail locomotives within the boundary. | 1 | |
| Marine | Direct emissions from boats including private craft on lakes and rivers, and commercial shipping operating on rivers and around ports | 1 | |
| Air | Indirect emissions attributed to regional domestic and international air travel demand. | 3 | |
| Source | Description of Source | Scope | |
| Solid Waste (direct) | Direct emissions from regional landfills and waste incinerators. Grid-connected waste-to-energy (WTE) facilities are reported under Scope 1 in Power Generation. | 1 | |
| Solid Waste (indirect) | Indirect emissions attributed to communities based on the amount of solid waste they create within the boundary. | 3 | |
| Sewage | Direct emissions from wastewater treatment plants and septic systems within the boundary. | 1 | |
Agriculture: There are three main GHG sources from agricultural activities, enteric fermentation, manure management, and fertilizer usage. Depending on land use, this sector can typically range from a small % (1-2) or large % (20-30) of overall emissions for a community.
| Source | Description of Source | Scope | |
| Livestock / Manure | Direct emissions from livestock operations (enteric fermentation and manure management) within the boundary. | 1 | |
| Fertilizer and Soils | Direct emissions from cropland management and fertilizer application within the boundary. | 1 |
| Source | Description of Source | Scope | |
| Residential Energy | Direct emissions from natural gas, fuel oils, wood, and propane consumed within the boundary. | 1 | |
| Commercial Energy | Direct emissions from natural gas, fuel oils, wood, and propane consumed within the boundary. | 1 | |
| Industrial Energy | Direct emissions from natural gas, fuel oils, wood, propane, coal, residual fuel oils, petroleum coke, and others consumed within the boundary. | 1 | |
| Power Generation | Direct emissions from grid-connected power generating facilities of capacity 1 MW or greater within the boundary. | 1 | |
| Transmissions and Losses (T+D) | Direct fugitive emissions of natural gas that leaks from the gas transmission and distribution system within the boundary. Direct fugitive emissions from gas, oil, and coal production sites. | 1 |


